
Key takeaway: Etcd is a consensus-based key-value store with real limits on write throughput and total data size, and the Kubernetes API server’s health depends entirely on staying within them.
What Actually Lives There
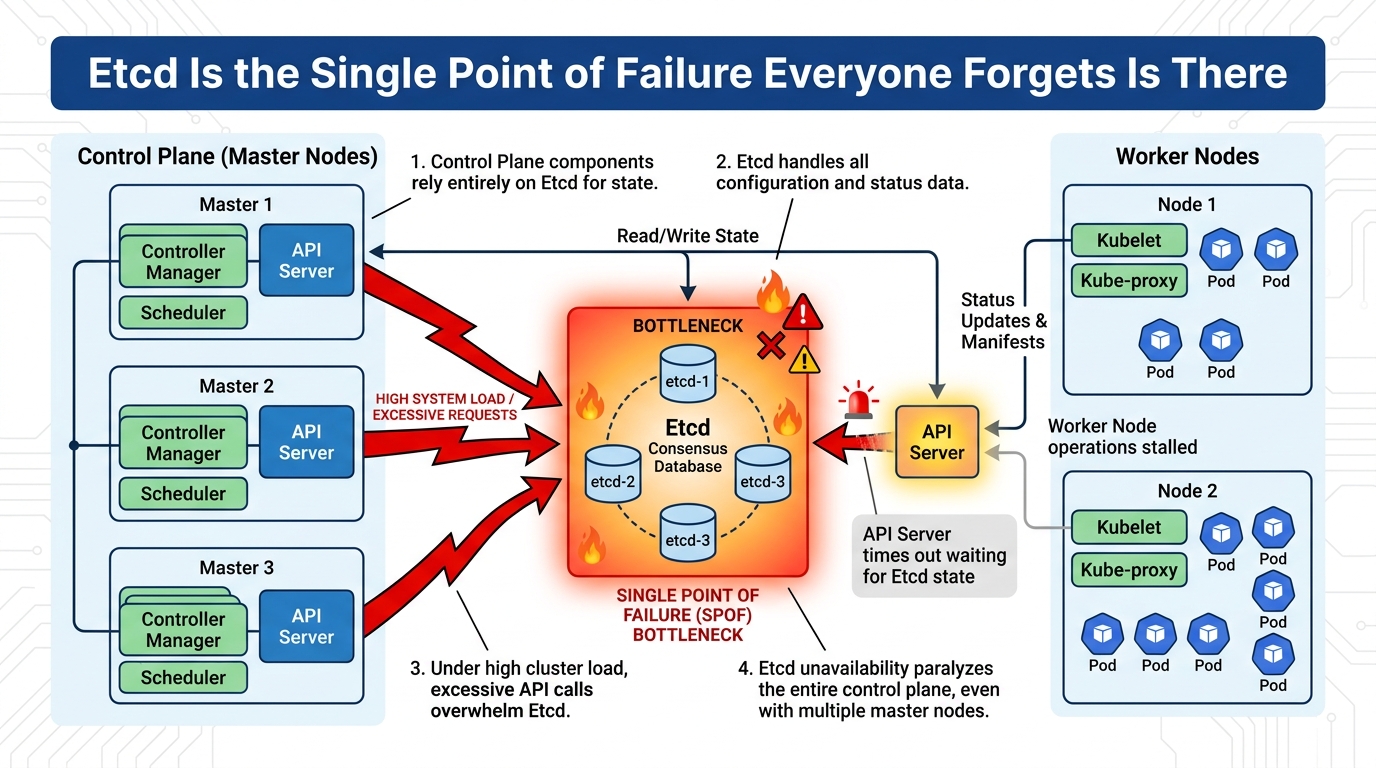
Every object in a Kubernetes cluster — pods, deployments, secrets, config maps, every custom resource any operator creates — is a record in etcd, and every read or write to the Kubernetes API ultimately touches it. The API server is a thin layer in front of etcd; etcd is where the actual state and its consistency guarantees live.
This means etcd performance is not an implementation detail hidden below the API — it directly gates the responsiveness of the entire cluster, and a struggling etcd manifests as a struggling cluster in ways that are not always obviously traced back to the actual bottleneck.
Where the Limits Actually Bite
| Symptom | Common cause |
|---|---|
Slow kubectl responses cluster-wide |
etcd write latency, often disk-related |
| API server timeouts under load | etcd struggling with request volume |
| Cluster-wide instability during high object churn | Too many rapidly changing objects (many CRs, frequent updates) |
| Database size warnings | Total etcd size approaching its configured limit |
Disk performance is the most common root cause and the least obvious one, because etcd’s consensus protocol requires committing writes to disk before acknowledging them — a network-attached disk with inconsistent latency, or a disk shared with other I/O-heavy workloads on the same node, directly degrades every write to the cluster’s state.
High-churn workloads are the other common trigger. An operator managing thousands of custom resources that update frequently — a controller reconciling status fields on every resource every few seconds, for instance — generates sustained write load that a design intended for occasional deployment changes was not sized for.
Practical Limits to Design Around
Etcd has a default size limit well below what feels intuitive for “just some Kubernetes objects,” and exceeding it puts the cluster into a read-only state until the size is reduced — a genuinely disruptive failure mode that is entirely preventable by monitoring the metric before it is reached.
Object count and update frequency matter more than raw data size for most clusters. A custom resource with a status field updated every few seconds, multiplied across thousands of instances, generates continuous write pressure that accumulates regardless of how small each individual object is.
Mitigations Worth Knowing
Use dedicated, fast local disks for etcd rather than sharing storage with other workloads, and monitor disk latency specifically for the etcd volumes rather than assuming general node health metrics capture it.
Reduce unnecessary update frequency in custom controllers. A status field that genuinely needs updating every thirty seconds does not need updating every three, and the difference compounds significantly at scale across thousands of resources.
Monitor etcd’s own metrics directly — database size, write latency percentiles, leader election frequency — rather than only monitoring cluster-level symptoms, because by the time cluster-level symptoms appear, etcd is often already under meaningful strain.
Set alerts on database size approaching the configured limit well before it is reached, since recovering from a read-only etcd state requires active intervention rather than resolving itself.
The Bottom Line
Give etcd dedicated fast disk and monitor its write latency and database size directly rather than inferring its health from cluster-level symptoms. Design custom controllers to minimise unnecessary update frequency, since etcd’s actual limits are lower than intuition suggests and a size-limit breach puts the whole cluster into a disruptive read-only state.