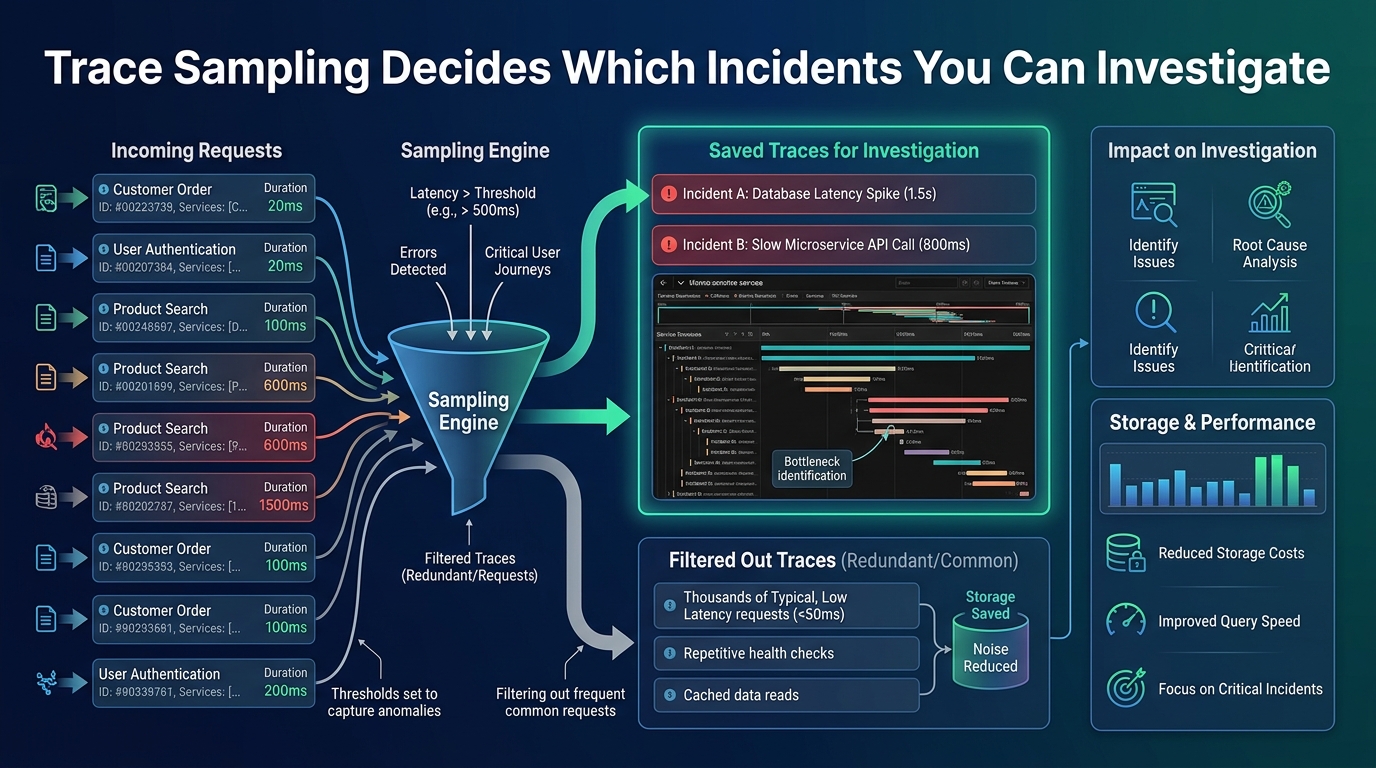

Key takeaway: Random head sampling optimises for cost and discards exactly the rare failures you most need. Tail sampling keeps what is interesting and drops what is not.
The Problem With Sampling Up Front
Head sampling decides at the start of a request whether to record it, typically by a random draw. At one percent, ninety-nine of every hundred traces are discarded.
That works acceptably for aggregate latency statistics and fails completely for investigation. A user reports a failed request with an identifier. You look it up and there is no trace, because the sampling decision was made before anything knew the request would fail.
The traces that survive are overwhelmingly successful ones, since success is the common case. Errors — the traces with diagnostic value — are represented at the same one percent, which for a rare failure means effectively never.
Deciding After the Fact
Tail sampling buffers spans until the trace completes, then applies rules to the finished trace. Because the decision happens with full knowledge, it can be selective in useful ways.
| Rule | Retention |
|---|---|
| Trace contains an error | 100% |
| Latency above the SLO threshold | 100% |
| Touches a rarely exercised endpoint | 100% |
| Involves a specific tenant under investigation | 100% |
| Ordinary successful request | 1% |
This inverts the outcome. Every error is available for investigation while the volume of routine traffic is reduced, so total cost is similar and diagnostic coverage is dramatically better.
The cost is architectural. Tail sampling requires a collector that buffers all spans of a trace before deciding, which means spans from one trace must reach the same collector instance and be held in memory for the trace duration. That constrains deployment topology and adds a component to operate.
Head Sampling Done Better
Where tail sampling is not feasible, head sampling can still be improved.
Sample by route rather than uniformly. A high-volume health check endpoint can be sampled at a tiny rate while a low-volume checkout flow is sampled at a hundred percent, which reflects value rather than frequency.
Propagate the sampling decision consistently. If services make independent decisions, traces end up partially recorded, which is worse than either outcome because the gap is invisible in the resulting view.
Support forced sampling for debugging. The ability to set a header that guarantees a trace is recorded makes reproducing a reported problem straightforward.
What Traces Should Contain
Sampling determines which traces exist; attributes determine whether they are useful.
Include the identifiers needed to correlate — request ID, user or tenant ID, deployment version. High cardinality is acceptable in traces precisely because sampling controls the cost, which is why per-request identifiers belong here rather than in metrics.
Record the outcome on the span rather than only in a log. A span marked with an error status and a message is queryable; an error that only appears in a log line elsewhere requires a second search to find.
The Bottom Line
Adopt tail sampling so every error and slow request is retained while routine traffic is sampled down. Where that is not possible, vary head sampling rates by route and support a debug header that forces retention. Put high-cardinality identifiers in traces, where they belong.